The Mysterious Fiber Bomb Problem: A Debugging Story
By Kenton Varda - 30 Sep 2016
A month or two ago, we started seeing a mysterious problem in production: every now and then, one of our Node.js web server processes supporting Sandstorm Oasis would suddenly jump to 100% CPU usage (of one core) and stay there until it was killed. The problem wasn’t an infinite loop, though: the process continued to respond to requests, just slowly. Since the process continued to respond to requests, it continued to pass health checks and was never restarted automatically. But for users assigned to that shard, the service was essentially unusable, as every action would take seconds to complete. The problem left nothing at all suspicious in the logs – other than a gap in which far fewer requests that normal were being handled. At first, the problem only struck about once a week, seemingly at random.
This kind of bug is a web developer’s worst nightmare. How do you debug something which you can only reproduce once a week, at random, with real users on the line? What could even cause a process to slow down but not stop in this way?
What’s eating our CPU?
Obviously, we needed to take a CPU profile while the bug was in progress. Of course, the bug only reproduced in production, therefore we’d have to take our profile in production. This ruled out any profiling technology that would harm performance at other times – so, no instrumented binaries. We’d need a sampling profiler that could run on an existing process on-demand. And it would have to understand both C++ and V8 Javascript. (This last requirement ruled out my personal favorite profiler, pprof from google-perftools.)
Luckily, it turns out there is a correct modern answer: Linux’s “perf” tool. This is a sampling profiler that relies on Linux kernel APIs, thus not requiring loading any code into the target binary at all, at least for C/C++. And for Javascript, it turns out V8 has built-in support for generating a “perf map”, which tells the tool how to map JITed code locations back to Javascript source: just pass the --perf_basic_prof_only_functions flag on the Node command-line. This flag is safe in production – it writes some data to disk over time, but we rebuild all our VMs weekly, so the files never get large enough to be a problem.
Armed with this new knowledge, we waited. Finally, after a few days, my pager went off. I shelled into the broken server, recorded a ten-second profile, restarted Node, and then downloaded the data for analysis. Upon running perf, I was presented with this:
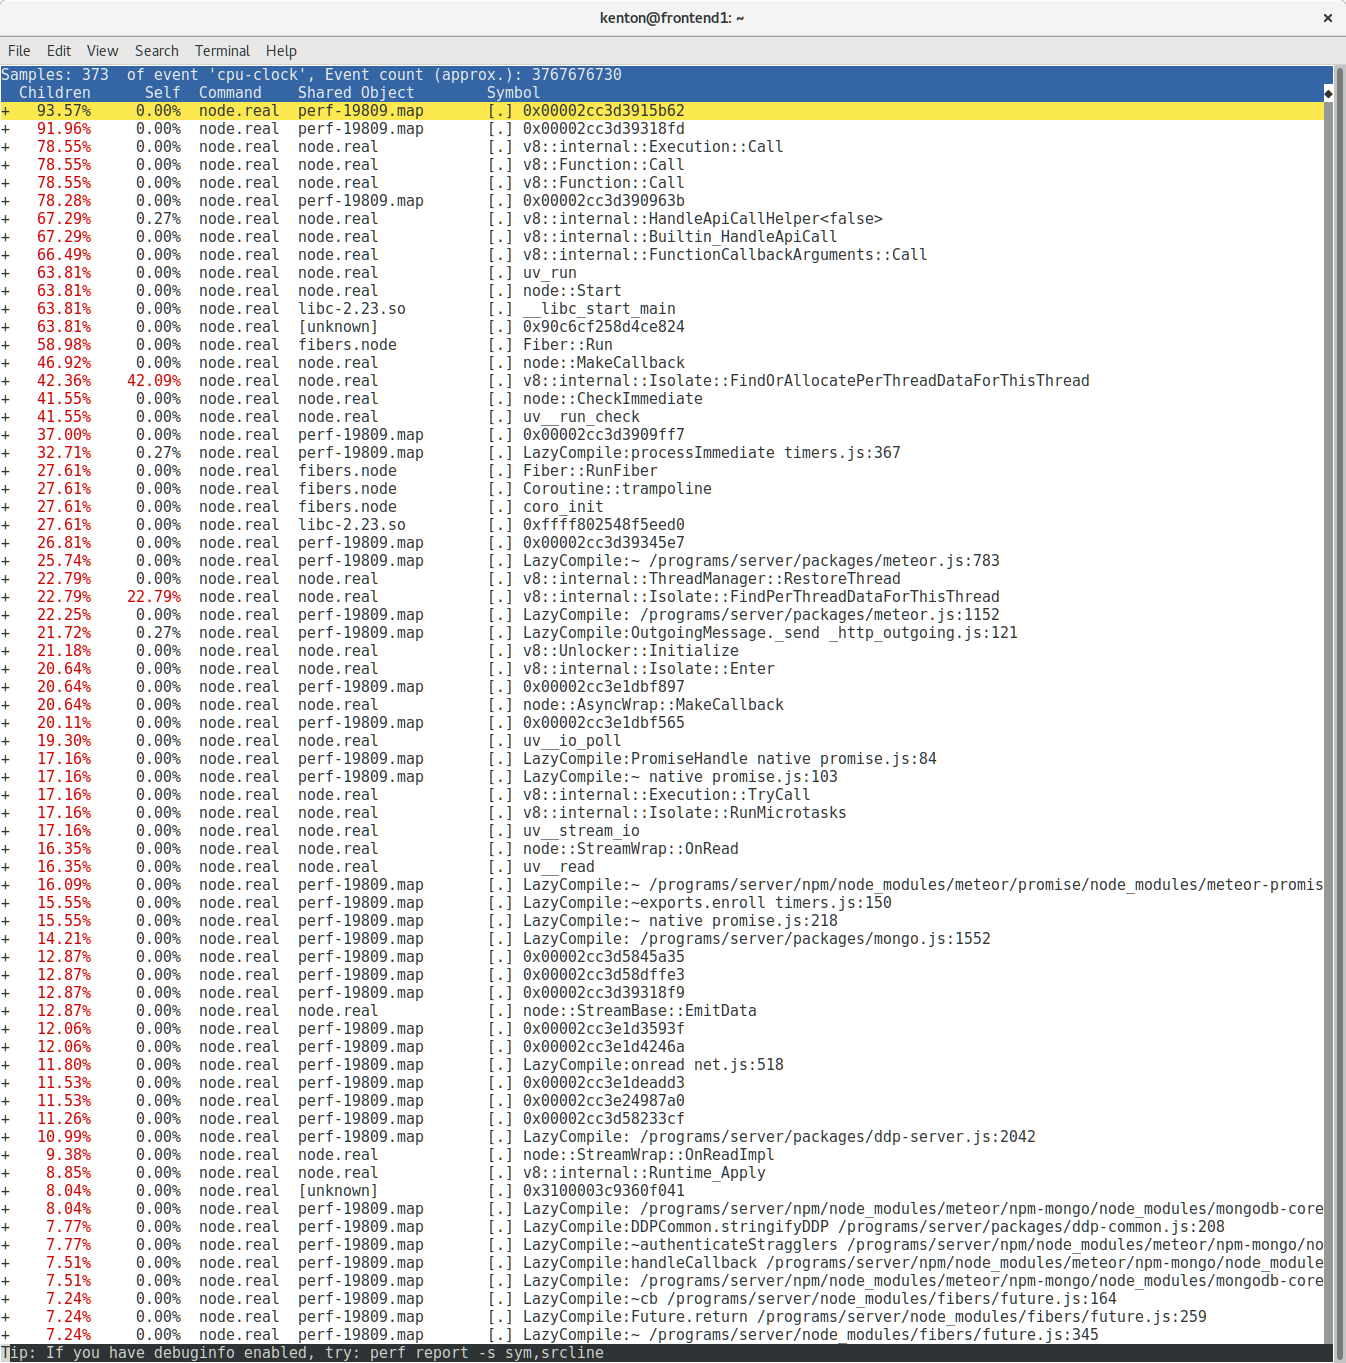
Well, this looks promising! Almost all the time is being spent in two C++ functions! The perf viewer makes it easy to jump directly into the disassembly:
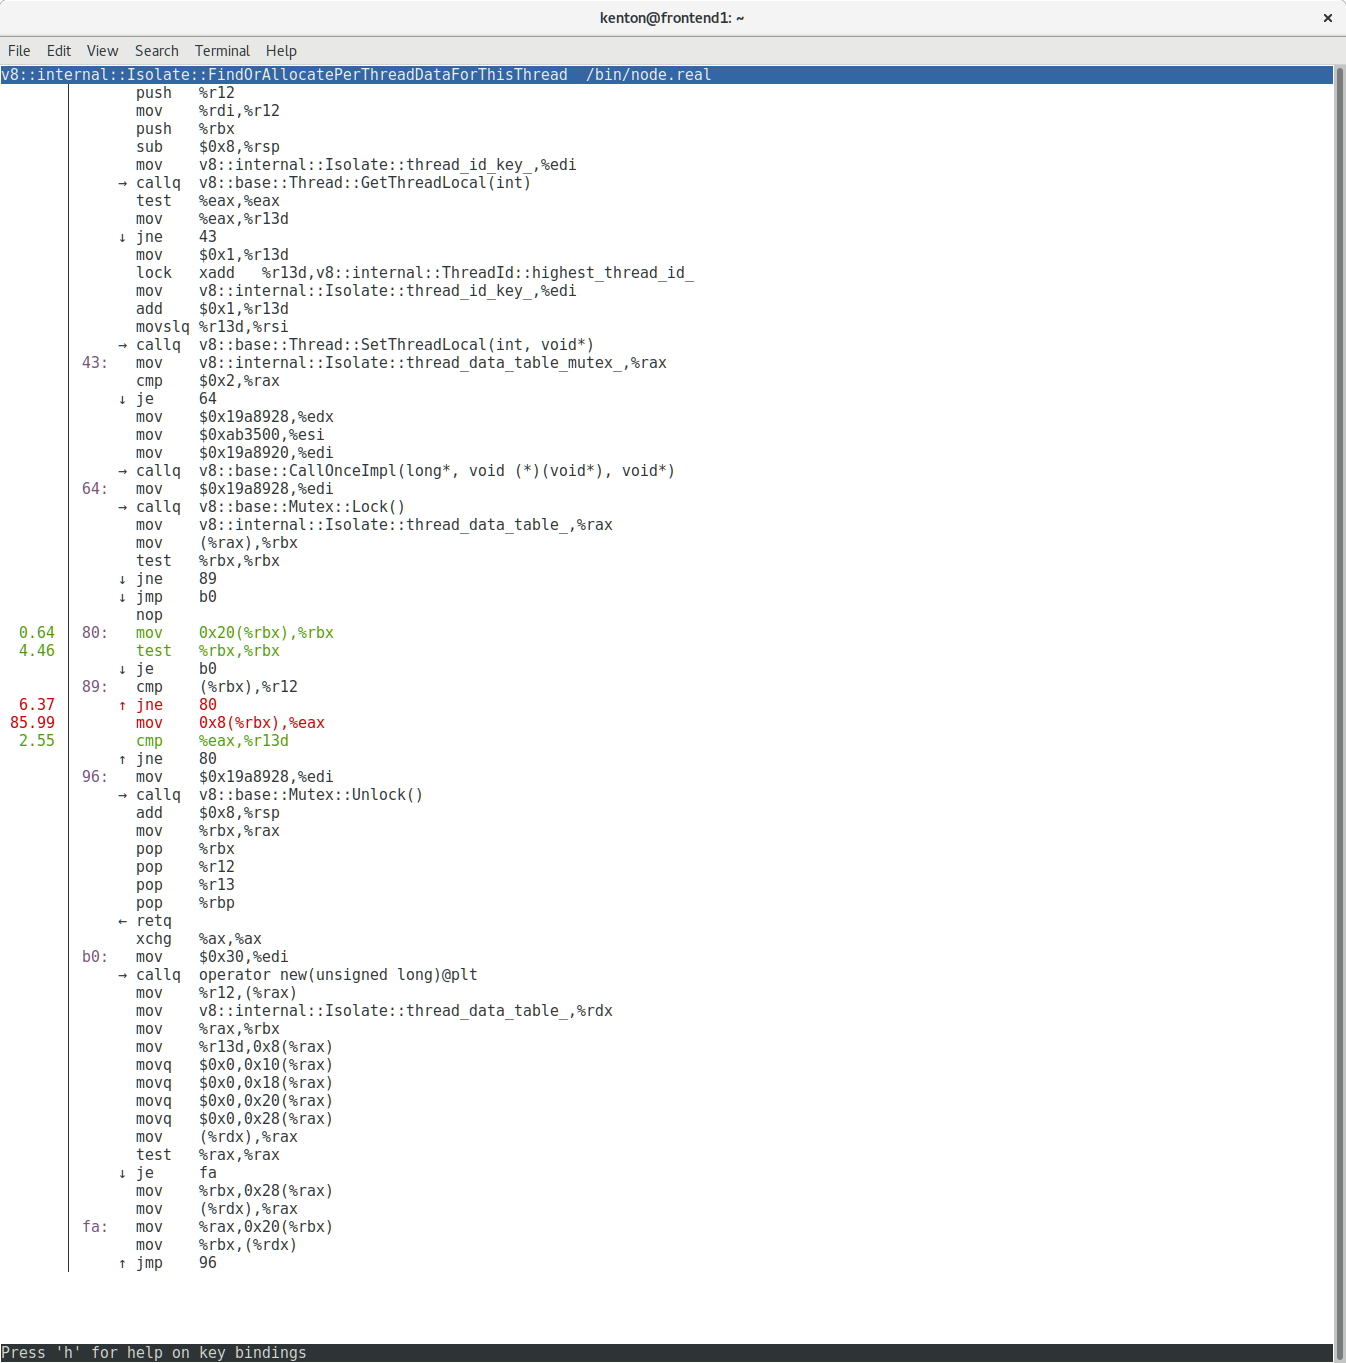
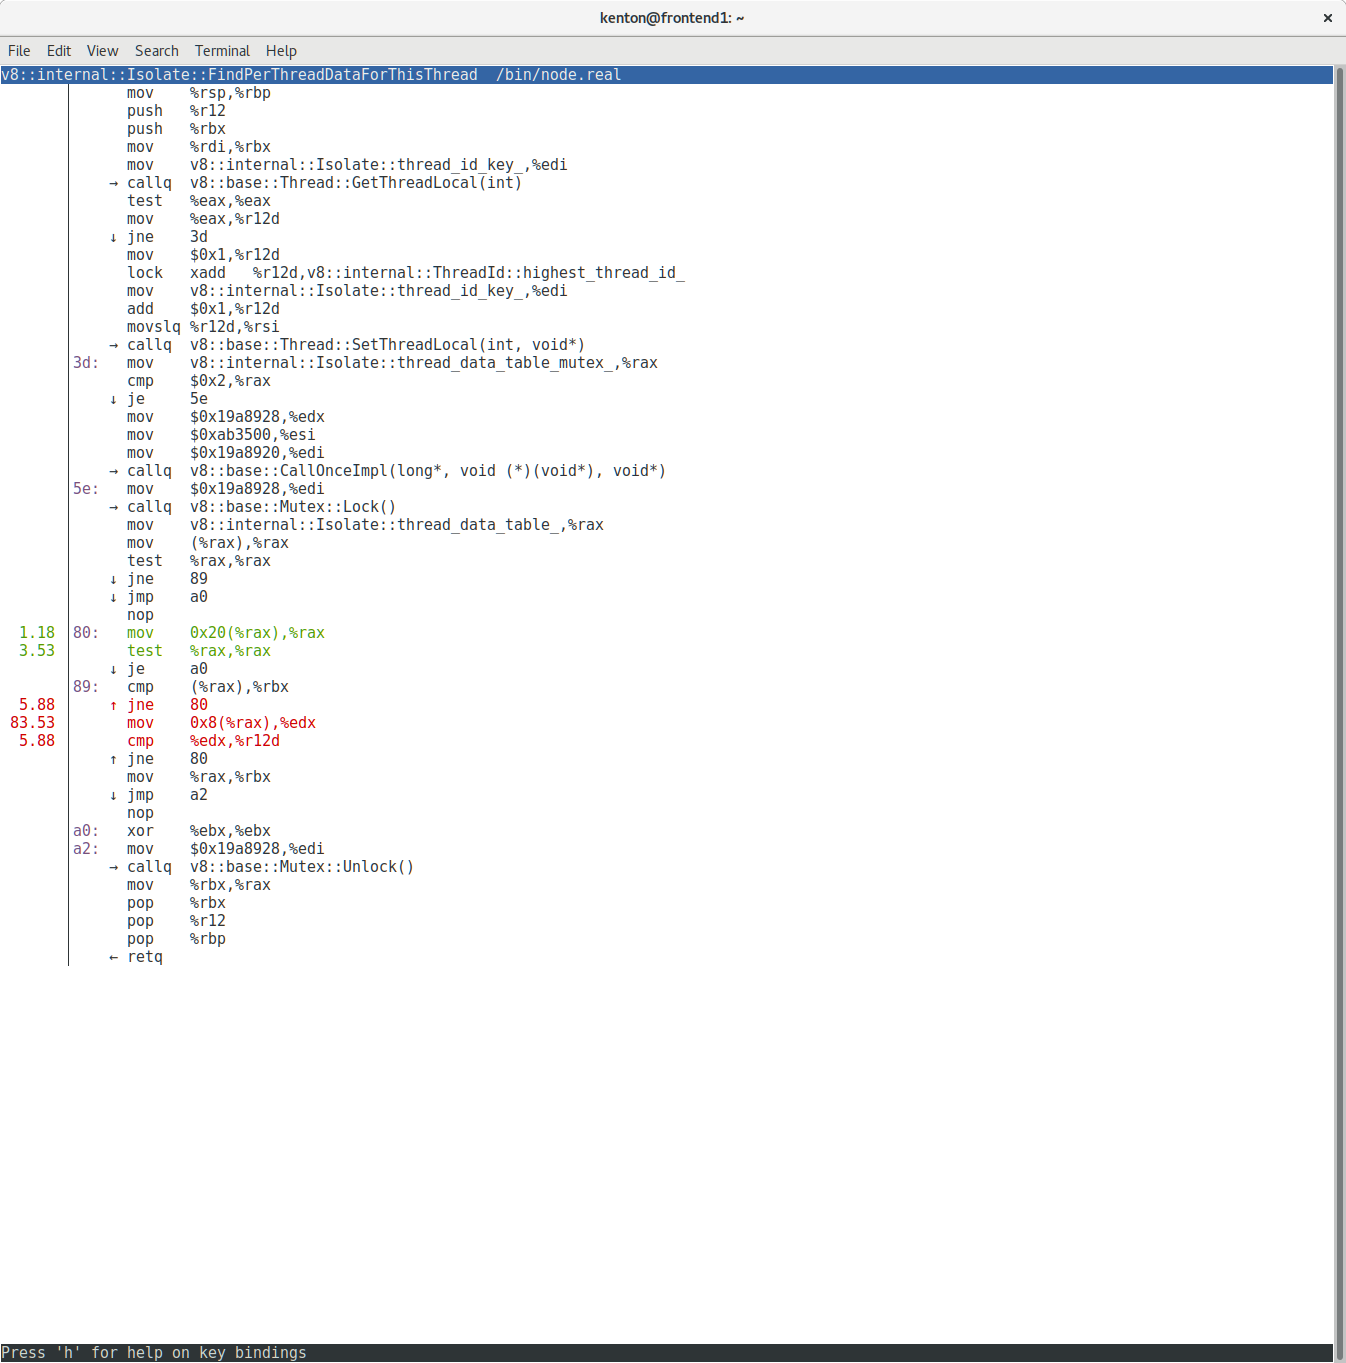
Wow! Almost all of our CPU time is being spent on a handful of instructions. In fact, what we’re looking at here is two different inlined copies of the same C++ code:
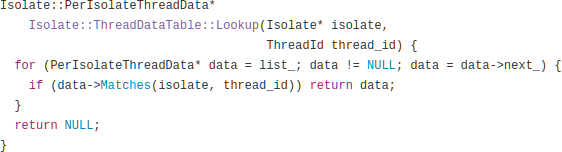
What you are looking at is a loop that traverses a linked list trying to find the element with a particular ID. We were spending the majority of our CPU time scanning one linked list.
V8 “threads” don’t scale
So, what is this code for?
You might be surprised to see the word “thread” in V8, which implements Javascript, a language known for being almost militantly opposed to threads. It turns out, though, that V8 supports “green threads” – simulated threads implemented entirely in userspace, with cooperative switching. Node users can take advantage of this via the node-fibers npm package. This package allows you to avoid Node’s “callback hell” by instead instantiating arbitrarily many call stacks and jumping between them whenever you need to wait for an asynchronous operation. Our code was, in fact, using node-fibers, mostly because we built on Meteor, which uses fibers by default.
The linked list in question implements a map from thread IDs to per-thread data, such as thread-local variables. Among other things, every time the process switches between fibers, the current thread is looked up in this table.
As any fresh CS grad knows, a linked list is not the ideal data structure for a lookup table – you probably want a hashtable, red-black tree, or the like. But as many more experienced engineers know, a linked list can be more efficient than those other structures in cases where the number of elements stays small. V8’s developers, as it turns out, had designed around the assumption of a fixed thread pool never containing more than a handful of threads. But node-fibers – especially as used by Meteor – doesn’t work this way. In Meteor, every concurrent operation gets its own fiber. Once a fiber completes, it is placed in a pool for reuse, but if many fibers are needed simultaneously, the pool can grow to any size. As the pool gets bigger, the linked list gets bigger, which makes fiber-switching slower, which makes the whole process permanently slower.
But what’s creating them?
But our processes weren’t getting slower over time. They were getting suddenly slower all at once. One moment the process is fine, the next it is hosed. Under normal load, our servers were sitting steady at around 100 fibers – nowhere near enough to be a problem. So now we had a new mystery: What was causing these sudden spikes in fiber creation? It was around this time we started referring to the incidents as “fiber bombs”. Alas, our profiles only showed us the after-effects of a bomb having gone off; they told us nothing about how the fibers were created in the first place. So we were back to square one.
Early on the morning of September 1st, the problem became suddenly more urgent: Instead of once a week, the problem started happening approximately once an hour. Like any good production problem, this began just after midnight. After three or so iterations of “get paged, wake up, restart the process, go back to sleep”, I grudgingly accepted that this could not wait until the morning. By about 5AM I had hot-patched our servers to monitor their own fiber counts and kill themselves whenever the number went over 1000 or so. In the process, I observed that a typical “fiber bomb” created anywhere from 5,000 to 20,000 fibers – all at once.
Still, the root cause was a mystery. With the servers now managing their own restarts and the pager quieting down, I crawled back into bed.
The spikes continued to happen approximately once an hour from then on. This was actually wonderful: it meant I could now iterate on the problem 150x faster than I could before! I began manually instrumenting the codebase with a sort of poor-man’s sampling profiler that specifically sampled fiber creation, and specifically did so at times when fiber counts seemed to be spiking. This turned out not as easy as it sounds, as there were many places that would create fibers as a result of some task having been queued previously. At the time of fiber creation, the queue insertion was no longer on the stack. So, I had to instrument the queue inserts too, and so on.
A bad monkey-patch
Soon, I made a startling discovery: It turned out that Meteor had monkey-patched the global Promise implementation. Specifically, they had apparently decided that they wanted .then() callbacks always to run in fibers, for convenience since most Meteor code requires that it be run in a fiber. Thus, they wrote code to intercept calls to .then() and wrap the callback in another callback that creates a new fiber and runs the original callback inside it.
This might sound basically reasonable at first (it should be “compatible” with standard Promise semantics), but there is a problem: In code that makes heavy, idiomatic use of Promises, it is common to string together a long chain of short .then() callbacks. As it so happens, Sandstorm itself contains a lot of Promise-based code, especially around communicating with its back-end, which it does using Cap’n Proto. Cap’n Proto’s API makes very heavy use of Promises, and does not expect to run in fibers. Thus, this code which seemingly had nothing to do with fibers was in fact the main creator of fibers in our system, creating massive quantities of totally unnecessary fibers, wasting memory and CPU time.
But even that didn’t actually explain the bombs. The way fibers work, if you start a new fiber that immediately completes, the fiber immediately goes back to the fiber pool. All of our Promise-heavy code operated in asynchronous style, therefore the callbacks would always complete immediately. So while the Promise code was needlessly starting lots of fibers, it should actually have been reusing the same Fiber object over and over again.
But there was one more wrinkle: It turns out that the V8 promise implementation itself sometimes calls .then() recursively, passing along one callback from one promise to another. In fact, it has to do this to correctly implement the spec. But since .then() had been monkey-patched, each time the same callback passed through another .then() call, it received another wrapper layer spawning another fiber. In the end, one callback, when finally called, would start a fiber, which would start another fiber, which would start another fiber, and so on. Since each fiber in this chain was itself responsible for spawning the next, all the fibers would be started before any completed. If one callback managed to be wrapped 20,000 times, then you get 20,000 fibers, all at once.
I patched the Promise monkey-patch such that, after wrapping a callback, it would mark the wrapped callback object with a field like alreadyWrapped = true. If the same callback came back to be wrapped again, the code would see this marking and avoid double-wrapping.
And just like that, the problem stopped.
Meanwhile, we’ve also filed an issue against V8, requesting that they replace their linked list with a hashtable. This wouldn’t have completely mitigated the fiber bombs, but it would have at least prevented them from permanently crippling the process.